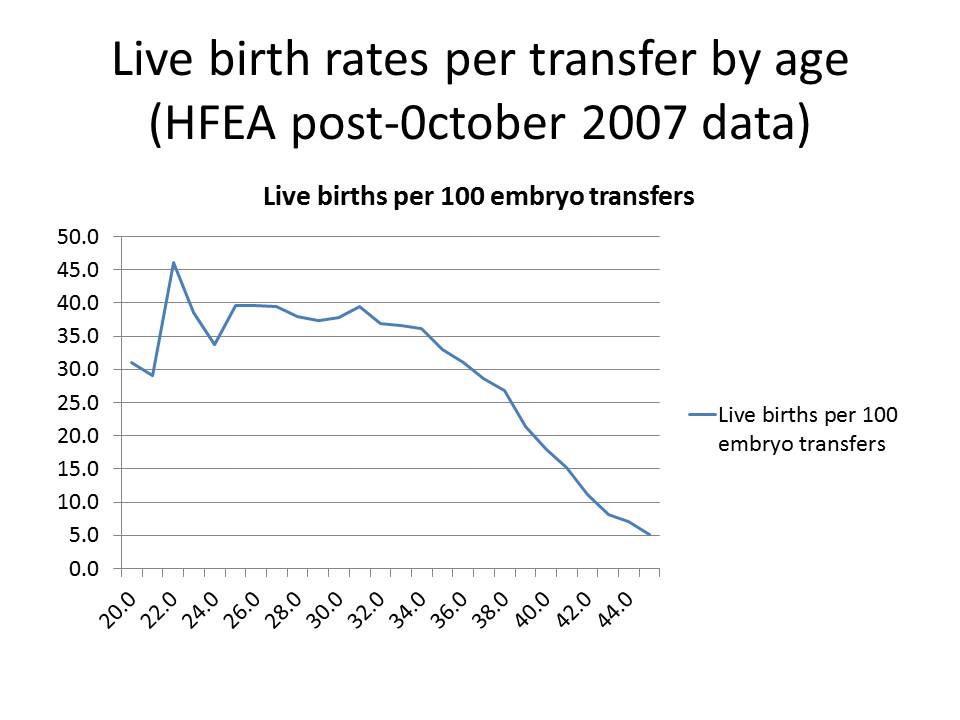
IVF success in terms of live births per 100 embryo transfers
Last reviewed 01/2018
In the graph below the vertical axis shows embryo transfers; the horizontal axis shows age of woman
- shows the live birth date per embryo transfer falls significantly after a woman is in her mid 30s
- based on all 52,996 embryo transfers using the woman's own eggs undertaken in the UK between 1 October 2007 and 30 June 2009) (note: small numbers of women aged under 24 years in the HFEA database)

Reference: